Monitoring Deforestation using Deep Learning with Satellite Data
CNN Land Classification Model and Application for the Indonesian province of Ketapang
Accounting for over 10% of global GHG emissions, tropical deforestation is one of the major drivers of greenhouse gas emissions. Therefore, monitoring and preventing deforestation is key to mitigating climate change. Satellite image data is becoming more readily and freely accessible, making it one of the most promising methods to quickly identify and measure deforestation activity.
This project aims to demonstrate the viability of free, open-source deforestation measurement via machine learning. The goal is to develop a reliable classification model that could be applied to deforestation monitoring at a global scale, and apply it in real-world deforestation detection in Indonesia.
Step 1: Train a Land Classification Algorithm
The data
To build the classifier model, I used the EuroSAT dataset, which consists of 27,000 labeled and georeferenced images provided by the Sentinel-2 satellite. The dataset was assembled as part of a 2018 article published by Helber et al.5 The images are categorized into 10 land use classes: (a) industrial buildings (b) residential buildings, (c) annual crop (d) permanent crop (e) river (f) sea and lake (g) herbaceous vegetation (h) highway (i) pasture (j) forest.
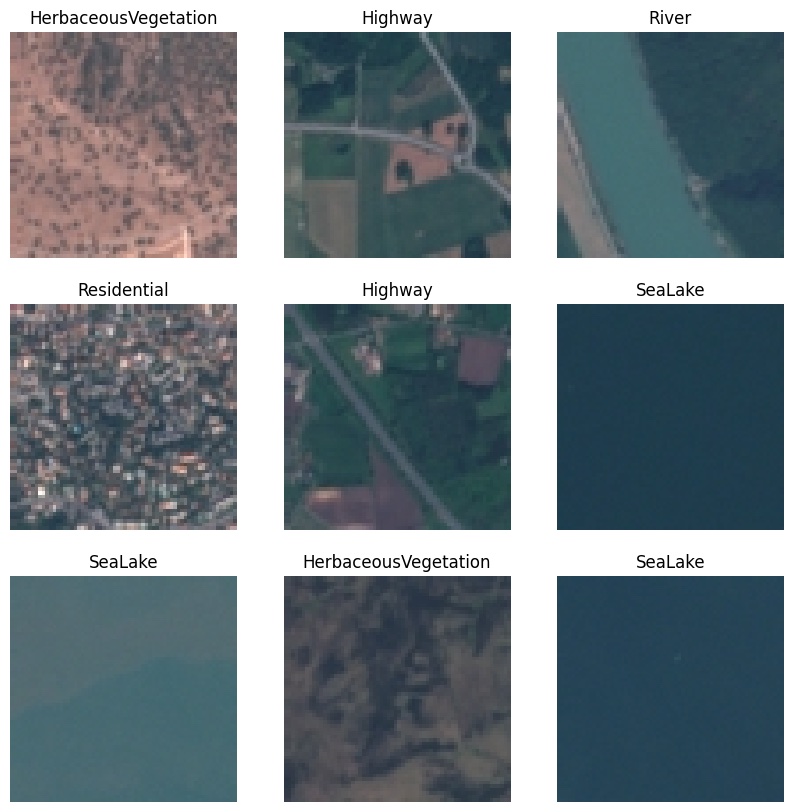
One advantage of the Eurosat dataset is that it uses Sentinel-2 satellite image data, which is open source and freely available. This means we can test our algorithm on newly-pulled Sentinel-2 data in Indonesia.
Another advantage is the dataset’s size and standard usage as a dataset for training land-use classification algorithms. However, the majority of its image data are from Europe, and it includes very few forest images (and no rainforest). This means that applicability to out-of-distribution data like images of Indonesian rainforest could be a problem.
Training the Model
For this project, I built two models, both of them CNNs, as I wanted to experiment with home-grown networks as well as transfer learning.
Custom CNN: For the custom model, I built a 20-layer neural network (19 hidden layers), which includes 3 “sets” of layers, each with 3 convolutional layers followed by batch normalization layers. These sets of layers are each followed by a max pooling layer, decreasing the dimensions of the data, but increasing the depth (from 256, to 512, to 728). There is then one dense layer of size 1024 before the output layer. This model performed reasonably well, reaching over 88% test accuracy after only 10 epochs of training without any hyperparameter tuning.
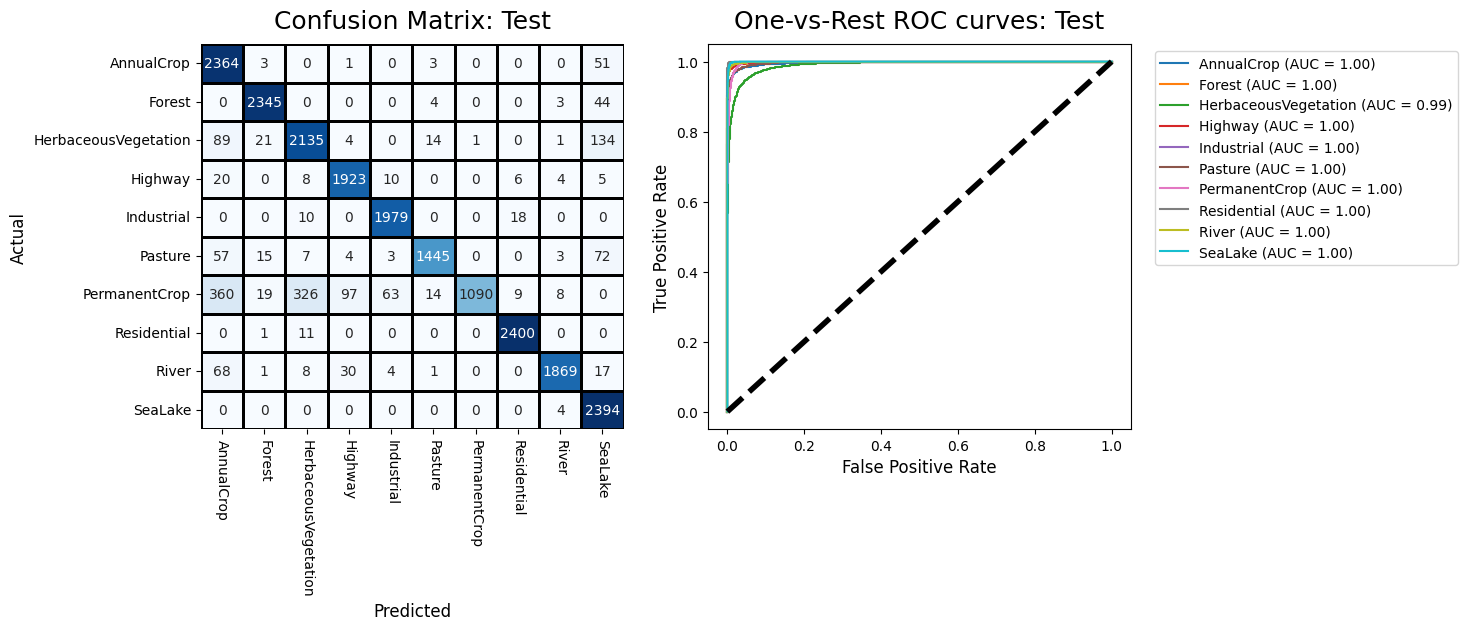
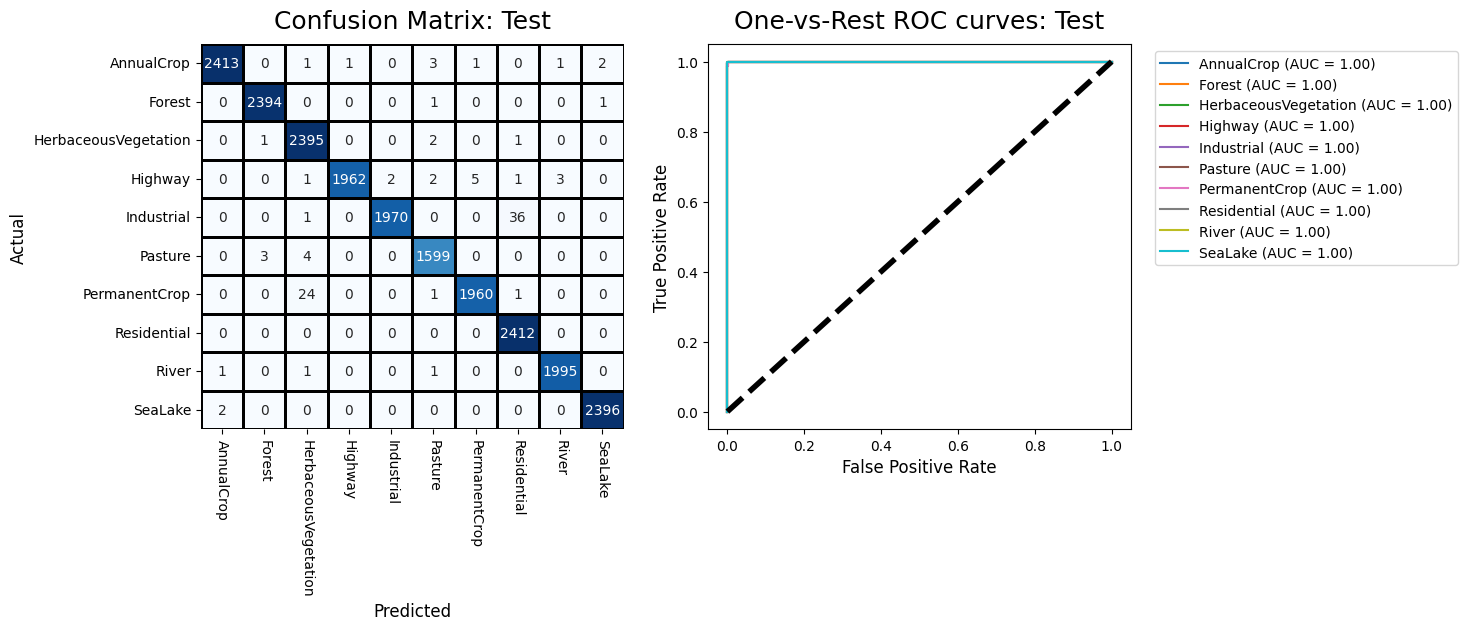
Transfer learning with ResNet 152v2: Transfer learning involves first downloading and instantiating an existing pre-trained neural network. We used ResNet152v2, a high-performing but relatively low-weight neural network. ResNet152v2 is a 152-layer network that makes clever use of skip-connections and other learning techniques to allow for much deeper models. Since ResNet normally expects a 224 by 224 image, I added a 64 by 64 input later, as well as a fully-connected layer and an output layer at the end. I first trained just the new input and output layers for 20 epochs at a normal learning rate to allow them to “catch up” to the rest of the weights. We then trained the entire model at a very low learning rate for another 10 epochs. This strategy is generally in line with the norms of transfer learning. The results for this method were extremely promising, reaching nearly 95% accuracy (in line with state-of-the-art research). Due to its superior performance, I elected to use this model for the remainder of our analysis.
Step 2: Apply to New Data and Map Some Deforestation
Credit to my collaborators Sohee Hyung, Justine Bailliart, and Sang-gyu Jung for assistance with this portion!
Data Extraction
Image data were extracted from the European earth observation program Sentinel-2 and merged with a shapefile for the Indonesian province of Ketapang on Borneo Island. We downloaded raster files from the Copernicus Browser6 for two periods, one ranging from 01/2020 to 12/2020, and one ranging from 07/2022 to 04/2023.
Data Processing
Once the raster file is imported into Python, I split it into 64 x 64 images, matching the original training data format. .tiff files also simply mark any pixels outside the shapefile as black, so I created a basic image mask to exclude images with any of those empty pixels.
Dealing with Clouds
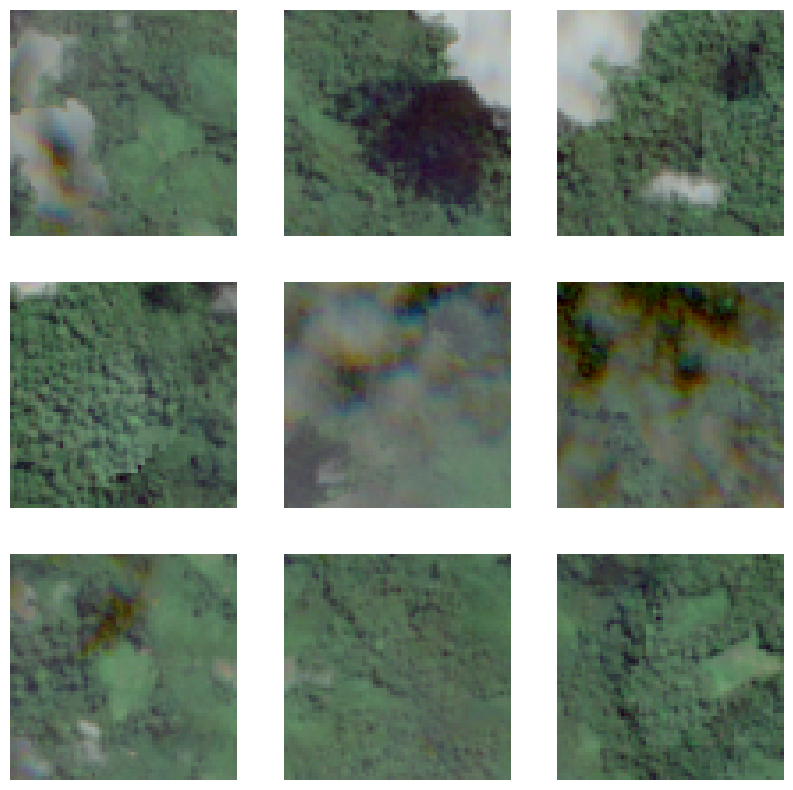
Even though we tried to minimize cloud cover in the assembled satellite images, there was still sparse cloud cover. Neural networks tend to struggle with out-of-class images, and mine were not trained to ignore clouds. Therefore, I filtered out cloudy 64x64 tiles by removing those with higher average pixel values (as white clouds drive up the value of pixels in the image). This worked reasonably well:
Dealing with out-of-sample issues
Even with high performance on the EuroSAT dataset, our model may struggle with different context of rural Indonesia. To help alleviate the likelihood of misclassification, we ignored predicted results in which the highest value in the softmax output vector was less than 0.95. This eliminated a significant portion of predictions but allowed us to produce a final set of results in which we were more confident.
Once these precautions are taken, the classifier seems to translate surprisingly well to the Indonesia image data. Here’s a random sample of classified data from Ketapang:

Mapping Deforestation
Prediction was performed on the Indonesia data from both 2020 and 2022. After making sure that the corresponding images from each time period lined up. Then, it’s just a simple matter of identifying any images which were labeled “forest” in 2020 and something else in 2022.
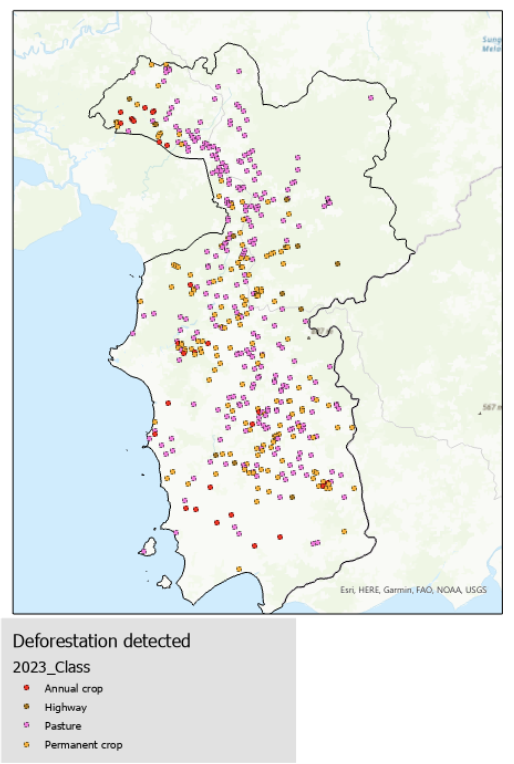
As mentioned before, there are some serious concerns with the out-of-sample nature of this Indonesia data. Just to eye-test our results, I pulled some comparison images in the areas that our algorithm flagged.

We can see that, while some of these might be detecting actual deforestation, most of them are definitely not. In my mind, this meets the project goals in that it serves as a valid proof-of-concept for this technology. However, it clearly needs much more development and fine-tuning before real-world utilization.
Next Steps…
Fine-tuning with custom Indonesia data
The next thing I’d like to do here is fine tune the algorithm on a custom-labeled dataset from Indonesia. In fact, the first pass of our model can prove useful here, as it has labeled what it thinks is forest vs. non-forest, making it easy for us to go through, check the labels, and quickly reach a nicely populated training set. Fine-tuning the model with this new dataset should allow us to leave the European biases in the rear-view mirror.
Explore automation
I’m not sure what APIs the good people as Sentinel-2 have implemented, or what they cost, but this functionality is obviously prerequisite for a fully-functioning product. I’d like to at least toy around with it to round out the proof-of-concept pipeline.