Using satellite imagery to monitor remote rural economies at high frequency
View our open source code on GitHub
Working methodology paper (pre-publish)
Despite global progress in reducing extreme poverty, stubborn pockets remain, often in remote and fragile regions. A fundamental obstacle to further progress is that remoteness and fragility also constrain our ability to monitor economic conditions. Using satellite imagery, we develop a new approach to monitor economic activity at periodic markets, focal points for rural trade throughout history and much of the world today. We describe how to detect marketplaces without pre-existing maps and how to construct an up-to-weekly measure of their activity. We show that we successfully detect marketplaces and that activity correlates with other measures of economic activity, captures seasonal patterns, and responds to local weather and conflict. Drawing on high frequency, globally available imagery, our approach enables real-time monitoring of economic activity independent of ground conditions.
Which marketplaces does our methodology detect?
The term ‘market’ can describe a wide range of phenomena. We focus on locations where people gather to trade on a weekly basis and, at least partly, under open-air. These two features allow us to identify marketplaces in high-resolution satellite imagery without prior knowledge of their locations. Market detection proceeds in two main steps.
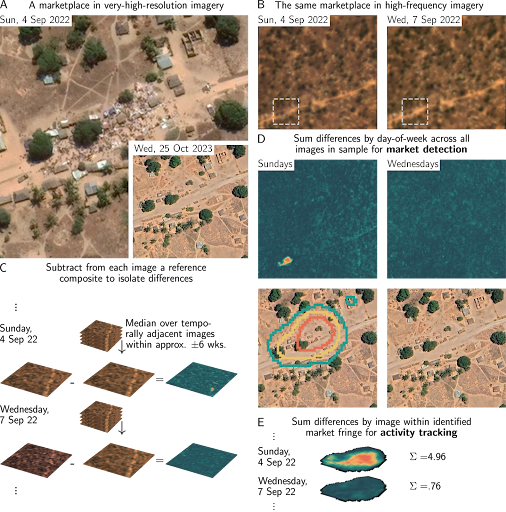
We identify locations that are relatively likely to have marketplaces - towns, road intersections, or places that change their appearance on a weekly basis in comparatively low-resolution Sentinel-2 imagery. We call these locations ‘candidate locations’. We scan stacks of high-frequency, high-resolution PlanetScope satellite imagery, captured between 2017 and 2023, to detect periodic changes in the appearance of each candidate location (see the Figure on the right). These changes are characteristic of open-air markets that operate once or twice a week. Please reach out to us if you’re interested in the whole set of candidate locations that we have screened so far.
Note that the MAI does not necessarily capture every location where trade occurs. There could be markets we haven’t screened yet, or ones where our method doesn’t detect a periodic signal. For more details on the accuracy of our approach, have a look at our working paper.
How we detect markets and market activity
Marketplaces appear differently in satellite imagery on market days compared to non-market days. On the former, colourful crowds, stalls and vehicles cover the market area, whereas on the latter, bare ground or asphalt will be visible. From each satellite image taken on a local market day, we construct a summary measure of the differences between that day and the market’s usual appearance on a non-market day. The larger these aggregate differences, the less of the bare ground is visible, and we assume that this reflects a busier market.
In the dashboard, we’ve indexed the raw aggregate differences to their average in 2021. Thus, a value of 100 indicates that market activity on a given day matched the 2021 average. A value of 0 indicates that there was no discernible difference between activity on detected market days and activity on other days.

(A) A marketplace in Nangata, Mozambique (14.21°S, 40.70°E) as seen in the Google Earth Archive on a non-market day (Wednesday) and a market day (Sunday). Market activity is discernible as crowds, stalls, and vehicles in the Sunday image. (B) The same location on a Sunday and a Wednesday in PlanetScope imagery. (C-E) Illustration of workflow for market detection and activity tracking. Individual PlanetScope images between June 2016 and September 2023 are differenced with median composites from temporally adjacent images primarily from within 6 weeks (see Materials & Methods) – approximating the appearance on a non-market day – to isolate appearance differences due to market activity (C). Aggregate differences per day-of-week identify market shapes at various threshold levels (D). The high-resolution images show the area in which market shapes are detected at various threshold levels. Market activity readings within these shapes are derived by summing differences across pixels within each shape and image (E). We then select as the market area to consider the area and associated readings from the largest shape in which the median reading across all market days in the sample exceeds the reading at the 75th percentile across non-market days.